Galaxy Announces Third Quarter 2026 Financial Results
PR Newswire
NEW YORK, Oct. 27, 2026
NEW YORK, Oct. 27, 2026 /PRNewswire/ -- Galaxy Digital Inc. (Nasdaq: GLXY) (the "Company" or "GDI") today released financial results for the three and nine months ended September 30, 2026. In this press release, a reference to "Galaxy," "we," "our" and similar words refers to GDI, its subsidiaries and affiliates, and, prior to the Reorganization Transactions, refers to Galaxy Digital Holdings LP (the "Partnership" or "GDH LP"), its subsidiaries and affiliates, or any one of them, as the context requires. 1
"Galaxy delivered a strong third quarter, reflecting the strength of our established Digital Assets franchise, significant appreciation across our investments portfolio, and the growing contribution from our Data Centers business. Our strategy is centered on two significant opportunities in the global economy: the modernization of financial markets through digital assets and the expansion of AI infrastructure. The progress we're making across both businesses is strengthening and diversifying our earnings profile, while positioning Galaxy to capitalize on substantial growth opportunities. We remain focused on disciplined execution and creating long-term value for our shareholders," stated Mike Novogratz, Founder and Chief Executive Officer.
— Financial and Business Highlights
- Q3 2026 net income of $323 million and diluted and adjusted EPS of $0.66 and $0.83, respectively2
- Q3 2026 adjusted gross profit of $569 million and adjusted EBITDA of $455 million
- Total equity of $3.0 billion and cash, stablecoins, and U.S. Treasuries of $4.9 billion
- Repurchased 9.8 million shares year-to-date, more than offsetting equity-based compensation dilution
- Board approved additional $200 million share repurchase authorization
- Substantially expanded data center footprint bringing total gross power pipeline to over 5.7 GW
- Completed $3.5 billion offering of senior secured notes to fund construction of Helios I, Phase II
SELECT FINANCIAL METRICS | Q3 2026 | Q2 2026 | Q/Q % Change | ||||
Total Assets | $16.4B | $10.8B | 51 % | ||||
Total Equity | $3.0B | $2.7B | 10 % | ||||
Cash, Stablecoins, and U.S. Treasuries3 | $4.9B | $2.5B | 99 % | ||||
Net Digital Assets and Investments4 | $1.7B | $1.2B | 48 % | ||||
Net Income / (Loss) | $323M | ($85M) | N.M. | ||||
Adjusted EBITDA2 | $455M | ($77M) | N.M. | ||||
Note: Throughout this document, totals may not sum due to rounding. Percentage change calculations are based on unrounded results. N.M. is the abbreviation for "Not Meaningful". (1) On May 13, 2025, the Company, Galaxy Digital Holdings Ltd. and GDH LP consummated a series of transactions resulting in the reorganization of the Company's corporate structure (the "Reorganization Transactions"). (2) Adjusted EPS, Adjusted Gross Profit and Adjusted EBITDA are non-GAAP financial measures. Refer to pages 11 through 13 for more information and a non-GAAP to GAAP reconciliation to the most directly comparable GAAP measure. (3) Includes $1,325M in Cash and Cash Equivalents, $812M in Stablecoins, and $2,756M of U.S. Treasury Bills and Notes as of the end of Q3 2026 and $896M in Cash and Cash Equivalents and $1,563M in Stablecoins as of the end of Q2 2026. (4) Refer to page 5 of this release for a breakout of Galaxy's Treasury & Corporate net digital asset and investment exposure. | |||||||
— Galaxy Financial Snapshot
GAAP Revenues and Transaction Expenses | Q3 2026 | Q2 2026 | Q/Q % Change | |||
Gross Revenues & Gains/(Losses) from Operations | $8.7B | $8.7B | — % | |||
Gross Transaction Expenses | $8.0B | $8.5B | (6) % | |||
Segment Reporting Breakdown | Q3 2026 | Q2 2026 | Q/Q % Change | |||
Digital Assets Adjusted Gross Profit1 | $71M | $66M | 9 % | |||
Digital Assets Adjusted EBITDA1 | ($9M) | ($11M) | N.M. | |||
Data Centers Adjusted Gross Profit1 | $79M | $20M | 293 % | |||
Data Centers Adjusted EBITDA1 | $69M | $11M | 498 % | |||
Treasury & Corporate Adjusted Gross Profit1 | $419M | ($42M) | N.M. | |||
Treasury & Corporate Adjusted EBITDA1 | $395M | ($78M) | N.M. | |||
Adjusted Gross Profit1 | $569M | $43M | N.M. | |||
Adjusted EBITDA1 | $455M | ($77M) | N.M. | |||
Net Income | $323M | ($85M) | N.M. | |||
Note: Throughout this document, totals may not sum due to rounding. Percentage change calculations are based on unrounded results. N.M. is the abbreviation for "Not Meaningful". (1) Adjusted Gross Profit and Adjusted EBITDA are non-GAAP financial measures. Refer to pages 11 through 13 for more information and a non-GAAP to GAAP reconciliation to the most directly comparable GAAP measure. | ||||||
— Digital Assets
Global Markets
- Galaxy's digital asset trading volumes grew 12% quarter-over-quarter, outperforming the broader spot market, where volumes declined, highlighting the strength and breadth of the trading franchise.1
- Average loan book size of $1.8 billion was up 27% compared to the prior quarter, driven by demand for the Galaxy Onchain Financing Rate ("GOFR") alongside broader demand for financing as market conditions improved.
KEY PERFORMANCE INDICATORS | Q3 2026 | Q2 2026 | Q/Q % Change | ||
Global Markets Adjusted Gross Profit2 | $53M | $49M | 8 % | ||
Loan Book Size (Average) | $1.8B | $1.4B | 27 % | ||
Total Trading Counterparties | 1,763 | 1,741 | 1 % | ||
Global Markets Adjusted Gross Profit: Gross Profit from Galaxy trading activity, net of transaction expenses, and fee revenue associated with the Investment Banking business. Loan Book Size (Average): Average market value of all open loans, excluding uncommitted credit facilities. | |||||
Asset Management & Infrastructure Solutions
- Galaxy ended Q3 with $10.4 billion in combined assets under management and assets under stake, up 46% quarter-over-quarter.3
- Asset Management generated over $160 million of net inflows during the quarter, driven by the end of quarter launch of the Galaxy Sharplink Onchain Yield Fund, an institutional investment fund designed to deploy capital across DeFi liquidity protocols and other onchain yield-generating strategies.
- Galaxy entered a multi-year agreement with BNY, which oversees more than $60 trillion in assets under custody, to further advance digital asset infrastructure for institutional markets, including support for staking on BNY's Digital Asset Custody platform. In addition to staking, Galaxy is serving as a design partner to further advance BNY's digital asset platform infrastructure.
KEY PERFORMANCE INDICATORS | Q3 2026 | Q2 2026 | Q/Q % Change | |||||
Asset Management & Infrastructure Solutions Adjusted Gross Profit2 | $19M | $17M | 11 % | |||||
ETFs | $2.5B | $1.8B | 41 % | |||||
Alternatives | $3.3B | $2.6B | 30 % | |||||
Assets Under Stake | $4.6B | $2.8B | 64 % | |||||
All figures are unaudited. ETFs: Include assets in Galaxy-sponsored and sub-advised exchange-traded funds, including seed investments by affiliates, based on prices as of the end of the specified period. ETF assets include both Galaxy balance sheet and third-party assets. Changes in ETF assets are generally the result of performance, inflows/outflows, and market movements. Alternatives: Includes committed capital closed-end vehicles, fund of fund products, engagements to unwind portfolios, affiliated and unaffiliated separately managed accounts, and seed investments by affiliates, based on prices as of the end of the specified period. For committed capital closed-end funds, Alternatives are reported as Net Asset Value ("NAV") plus unfunded commitments. Alternatives for quarterly close vehicles are reported as of the most recent quarter available for the applicable period. Assets Under Stake: Represents the total notional value of assets bonded to Galaxy validators, based on prices as of the end of the specified period. These figures include both Galaxy balance sheet and third-party assets. Note: As of the end of Q3 2026, $1.2B of assets are captured within both Assets Under Stake and Alternatives. | ||||||||
(1) Source: The Block. Industry-wide trading volumes defined as spot cryptocurrency monthly exchange volumes, BTC futures, BTC options, and ETH options volumes. (2) Adjusted Gross Profit is a non-GAAP financial measure. Refer to page 11 for more information and a reconciliation to the most directly comparable GAAP measure. (3) Assumes prices for relevant cryptocurrencies as of 9/30/2026. |
— Data Centers
- Data Centers generated adjusted gross profit of $79 million and adjusted EBITDA of $69 million during the quarter, reflecting the first full quarter of revenue-generating operations under the Helios I, Phase I lease, with all 133 MW of critical IT load delivered to CoreWeave by the end of the second quarter.1
- Helios I, Phase II is fully financed and under construction, with both buildings and the supporting substation progressing on schedule and within budget, and with construction activity expected to ramp significantly over the coming months, with data hall deliveries scheduled to begin in the second quarter of 2027.
- Galaxy continues to advance discussions with prospective tenants for the additional 830 MW of approved capacity at Helios II not yet under lease, with market dynamics seen as increasingly favorable.
KEY PERFORMANCE INDICATORS | Q3 2026 | Q2 2026 | Q/Q % Change | ||
Data Centers Adjusted Gross Profit1 | $79M | $20M | 293 % | ||
Data Centers Adjusted EBITDA1 | $69M | $11M | 498 % | ||
Data Centers Total Assets | $6.8B | $2.5B | 166 % | ||
Data Centers Total Liabilities | $5.3B | $1.5B | 244 % | ||
Data Centers Quarterly Capital Expenditure | $757M | $448M | 69 % | ||
Delivered Critical IT Load to Date2 | 133 MW | 133 MW | — % | ||
(1) Adjusted Gross Profit and Adjusted EBITDA are non-GAAP financial measures. Refer to pages 11 and 12 for more information and a reconciliation to the most directly comparable GAAP measure. (2) Represents revenue-generating capacity delivered to tenants, reflecting cumulative capacity delivered at quarter end. | |||||
— Balance Sheet
Equity Capital
As of September 30, 2026, Galaxy had $3.0 billion in equity capital.
Below is a breakout of how the Company's equity capital is allocated across its Digital Assets, Data Centers and Treasury & Corporate segments.
$3.0 billion of equity capital across three segments: | ||||
~33% | ~48% | ~19% | ||
Digital Assets | Data Centers | Treasury & Corporate | ||
Treasury & Corporate Net Digital Asset and Investment Exposure
The Company's Treasury & Corporate segment maintains exposure to the digital asset ecosystem through a diversified allocation across spot positions, derivatives, ETFs, equities, venture investments, private equity holdings and fund investments.
The below pie chart is representative of the Treasury & Corporate segment's net digital asset and investment exposure as of September 30, 2026.
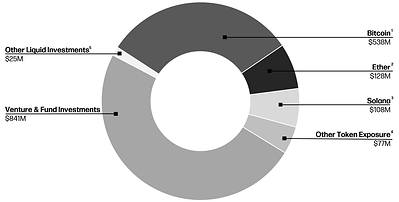
(1) Includes spot BTC, BTC derivatives, short and other hedge positions, associated tokens such as wrapped BTC, and interests in investment vehicles designed to hold BTC. |
(2) Includes spot ETH, associated tokens such as wrapped ETH, and interests in investment vehicles designed to hold ETH. |
(3) Includes spot SOL, SOL derivatives, short and other hedge positions, associated tokens such as wrapped SOL, and interests in investment vehicles designed to hold SOL, including Galaxy's investment in Forward Industries. |
(4) Represents spot positions and interests in investment vehicles that provide exposure to other digital assets. |
(5) Includes publicly traded securities, including those subject to a short-term lock-up. |
Capital Management
On October 26, 2026, the Company's Board of Directors authorized the repurchase of shares of the Company's Class A common stock in an amount up to $200 million, enabling the Company to opportunistically return value to shareholders. Repurchases will be subject to compliance with applicable securities laws and stock exchange requirements.
Galaxy previously announced a $200 million share repurchase program in February 2026, which was completed on October 15, 2026. In total under the program, Galaxy repurchased approximately 9.8 million shares of Class A common stock.
Galaxy may repurchase shares of its Class A common stock from time to time through open market purchases, in privately negotiated transactions, or by other means, including through the use of trading plans intended to qualify under Rule 10b5-1 under the Securities Exchange Act of 1934, as amended (the "Exchange Act"), in accordance with applicable securities laws, stock exchange requirements and other restrictions. The timing and total amount of stock repurchases will depend upon business, economic and market conditions, corporate, legal and regulatory requirements, prevailing stock prices, and other considerations. The share repurchase program does not have a fixed expiration date, may be suspended or discontinued at any time and does not obligate the Company to acquire any amount of common stock. There can be no assurances how many shares Galaxy will repurchase, if any, or at what prices any purchases will be made.
Earnings Conference Call
An investor conference call will be held today, October 27, 2026, at 8:30 AM Eastern Time. A live webcast will be available at https://investor.galaxy.com/ and on the Company's YouTube channel. A replay of the webcast will be available and can be accessed in the same manner as the live webcast on the Company's Investor Relations website. Through December 1, 2026, the recording will also be available by dialing 1-844-512-2921, or 1-412-317-6671 (outside the U.S. and Canada) and using the passcode: 18446.
About Galaxy Digital Inc. (Nasdaq: GLXY)
Galaxy Digital Inc. (Nasdaq: GLXY) is a global leader in digital assets and data center infrastructure, growing the economy that runs on code. Galaxy delivers the onchain infrastructure that connects institutions to digital assets, including trading, advisory, asset management, staking, self-custody, and tokenization. Galaxy also develops and operates data center infrastructure to power AI and HPC workloads. Anchored by its Helios campus in Texas, Galaxy is building a multi-gigawatt pipeline of more than 5.7 GW of potential capacity, positioning it among the largest and fastest-growing data center developers in North America. The Company is headquartered in New York City, with offices across North America, Europe, the Middle East, and Asia. Additional information about Galaxy's businesses and products is available on www.galaxy.com.
CAUTIONARY STATEMENT ABOUT FORWARD-LOOKING STATEMENTS
This press release and the accompanying conference call may contain "forward-looking statements" within the meaning of Section 27A of the Securities Act of 1933, as amended (the "Securities Act"), Section 21E of the Securities Exchange Act of 1934, as amended (the "Exchange Act") and the Private Securities Litigation Reform Act of 1995, and "forward-looking information" under Canadian securities laws (collectively, "forward-looking statements"). Our forward-looking statements include, but are not limited to, statements regarding our or our management team's expectations, hopes, beliefs, intentions or strategies regarding the future. Statements that are not historical facts, including, without limitation, statements about Galaxy's business plans and goals, including, without limitation, with respect to the Helios Data Center, lease agreements with CoreWeave, planned data centers, growth opportunities, our share repurchase program, our future prospects, power capacity and energization timelines, future reporting measures and business strategy, our future results of operations and financial position, and industry and market dynamics are forward-looking statements. In addition, any statements that refer to estimates, projections, forecasts or other characterizations of future events or circumstances, including any underlying assumptions, are forward-looking statements. The words "anticipate," "believe," "continue," "could," "estimate," "expect," "forecast," "intend," "may," "might," "plan," "possible," "potential," "predict," "project," "should," "will," "would" and similar expressions may identify forward-looking statements, but the absence of these words does not mean that a statement is not forward-looking. The forward-looking statements contained in this document are based on our current expectations and beliefs concerning future developments and their potential effects on us taking into account information currently available to us. There can be no assurance that future developments affecting us will be those that we have anticipated. These forward-looking statements involve a number of risks, uncertainties (some of which are beyond our control) or other assumptions that may cause actual results or performance to be materially different from those expressed or implied by these forward-looking statements. These risks include, but are not limited to: (1) the inability to maintain Nasdaq's listing standards; (2) costs related to AI/HPC plans, transactions, operations and strategy, including impairment charges recognized in connection with the conversion of our Helios mining infrastructure and negative Adjusted EBITDA in recent periods; (3) changes in applicable laws or regulations, and changes or events that impact the cryptocurrency and AI/HPC industry, including potential regulation, that are out of our control; (4) the possibility that the Company may be adversely affected by other economic, business, and/or competitive factors; (5) declines in the prices of digital assets or in the volume of transactions that we conduct, and our exposure to market risk on our digital asset and investment positions; (6) the risk that our business will not grow in line with our expectations; (7) the possibility that our addressable market is smaller than we have anticipated and/or that we may not gain share of it; (8) the possibility that there is a disruption or change in power dynamics impacting our results or current or future load capacity; (9) any delay or failure to consummate our business mandates or achieve our pipeline goals; (10) technological challenges, cyber incidents or exploits; (11) risks related to the construction of AI/HPC infrastructure, including the timing of construction and its impact on lease revenue; (12) any inability or difficulty in obtaining additional financing for AI/HPC infrastructure needs on acceptable terms or at all; (13) changes to the AI/HPC infrastructure needs and their impact on future plans at the Helios campus; (14) any delay in obtaining, or failure to obtain, necessary ERCOT power approvals; (15) risks associated with the leasing business, including those associated with counterparties; and (16) those other risks contained in filings we make with the Securities and Exchange Commission (the "SEC") from time to time, including in our Annual Report on Form 10-K for the fiscal year ended December 31, 2025, filed with the SEC on February 26, 2026 and available on Galaxy's profile at www.sec.gov (our "Form 10-K"), as such factors may be updated from time to time in our filings with the SEC, including without limitation, our Quarterly Report on Form 10-Q for the quarterly period ended September 30, 2026. Should one or more of these risks or uncertainties materialize, they could cause our actual results to differ materially from the forward-looking statements. Except as required by law, we assume no obligation to update or revise any forward-looking statements whether as a result of new information, future events or otherwise, or to update the reasons if actual results differ materially from those anticipated in the forward-looking statements. You should not take any statement regarding past trends or activities as a representation that the trends or activities will continue in the future. Accordingly, you should not put undue reliance on these statements.
This press release and our earnings call contain certain preliminary information about our performance in the third quarter of 2026. This information is preliminary and represents the most current information available to management. The Company's actual consolidated financial statements may differ materially as a result of the completion of normal quarterly accounting procedures and adjustments or due to other risks contained in our Form 10-K, as such risks may be updated from time to time in our filings with the SEC, including without limitation, our Quarterly Report on Form 10-Q for the quarterly period ended September 30, 2026. Although the Company believes the expectations reflected in this press release are based upon reasonable assumptions, the Company can give no assurance that actual results will not differ materially from these expectations.
Galaxy announces material information to the public through filings with the Securities and Exchange Commission, the investor relations and newsroom pages on its website (investor.galaxy.com and galaxy.com/newsroom), press releases, its LinkedIn profile (linkedin.com/company/galaxyhq), its X account (@galaxyhq), public conference calls and webcasts in order to achieve broad, non-exclusionary distribution of information to the public and for complying with its disclosure obligations under Regulation FD. Galaxy encourages investors and others to follow the channels listed above and to review the information disclosed through such channels.
Non-GAAP Financial Measures
In addition to our results determined in accordance with GAAP, this press release and the accompanying tables contain adjusted gross profit, adjusted EBITDA and adjusted EPS, which are non-GAAP financial measures. Adjusted gross profit, adjusted EBITDA and adjusted EPS are unaudited, presented as supplemental disclosure and should not be considered in isolation or as a substitute for, or superior to, the financial information prepared and presented in accordance with GAAP.
Please see pages 11-13 for a reconciliation of (i) adjusted gross profit to revenues and gains / (losses) from operations (including for our individual segments) during the three months ended September 30, 2026 and June 30, 2026, (ii) adjusted EBITDA to net income (loss) (including for our individual segments) during the three months ended September 30, 2026 and June 30, 2026 and (iii) adjusted EPS to diluted EPS for the three and nine months ended September 30, 2026 and 2025.
It is important to note that the particular items we exclude from, or include in, adjusted gross profit, adjusted EBITDA and adjusted EPS may differ from the items excluded from, or included in, similar non-GAAP financial measures used by other companies in the same industry. We also periodically review our non-GAAP financial measures and may revise these measures to reflect changes in our business or otherwise.
We believe adjusted gross profit is a helpful non-GAAP financial measure to our management and investors because it eliminates the impact of the directly attributable transaction expenses. As such, it provides useful information about our financial performance, enhances the overall understanding of our past performance and future prospects, allows for greater transparency with respect to important metrics used by our management for financial, risk management and operational decision-making and provides an additional tool for investors to use to understand and compare our operating results across accounting periods. Adjusted gross profit is defined as revenues and gains (losses) from operations excluding (i) transaction expenses and (ii) impairment of digital assets.
Adjusted EBITDA is a non-GAAP financial measure that is used by management, in addition to GAAP financial measures, to understand and compare our operating results across accounting periods, for risk management and operational decision-making. This non-GAAP measure provides investors with additional information in evaluating the Company's operating performance. Adjusted EBITDA represents Net income / (loss), excluding (i) equity-based compensation and related expense, (ii) notes interest and other expense, (iii) tax expense / (benefit), (iv) depreciation and amortization expense and (v) other discrete items which are not individually significant that we believe are not indicative of our ongoing results. The above items are excluded from our Adjusted EBITDA because these items are non-cash in nature, or because the amount and timing of these items are unpredictable, are not driven by core results of operations, and render comparisons with prior periods and competitors less meaningful.
Adjusted EPS is defined as diluted EPS assuming all outstanding noncontrolling interest holders exchanged their LP units in GDH LP for Class A common stock of the Company. This non-GAAP financial measure is commonly used as an analytical indicator of performance by investors within the industries in which we operate. Adjusted EPS should not be considered in isolation or as an alternative to or a substitute for financial statement data presented in the Company's consolidated financial statements as indicators of financial performance.
Investors are cautioned that there are material limitations associated with the use of non-GAAP financial measures as an analytical tool.
© Copyright Galaxy Digital 2026. All rights reserved.
Galaxy Digital Inc.'s Consolidated Statements of Financial Position (unaudited)
(in thousands) | September30, 2026 | December31, 2025 | |
Assets | |||
Current assets | |||
Cash and cash equivalents | $ 1,324,759 | $ 1,246,240 | |
Digital intangible assets (includes $2,886.2 and $2,717.4 million measured at fair value) | 3,840,754 | 3,526,216 | |
Digital financial assets | 454,529 | 988,621 | |
Digital asset loans receivable, net of allowance | 960,764 | 1,070,029 | |
Investments | 3,161,486 | 709,069 | |
Assets posted as collateral, net of allowance | 300,826 | 199,983 | |
Derivative assets | 236,572 | 83,807 | |
Accounts receivable (includes $3.1 and $3.4 million due from related parties) | 67,642 | 34,012 | |
Digital assets receivable | 4,725 | 3,778 | |
Loans receivable, net of allowance | 950,281 | 554,449 | |
Prepaid expenses and other assets | 55,393 | 99,734 | |
Total current assets | 11,357,731 | 8,515,938 | |
Non-current assets | |||
Digital assets receivable | 3,603 | 4,719 | |
Digital asset loans receivable, net of allowance, non-current | 6,114 | 8,900 | |
Investments (includes $1,218.4 and $864.0 million measured at fair value) | 1,438,415 | 1,023,236 | |
Digital intangible assets | 6,109 | 26,824 | |
Loans receivable, net of allowance, non-current | 5,575 | 2,553 | |
Property and equipment, net | 2,946,995 | 1,423,113 | |
Other non-current assets | 585,681 | 276,275 | |
Goodwill | 66,523 | 66,523 | |
Total non-current assets | 5,059,015 | 2,832,143 | |
Total assets | $ 16,416,746 | $ 11,348,081 | |
Liabilities and Equity | |||
Current liabilities | |||
Derivative liabilities | 188,259 | 40,482 | |
Accounts payable and accrued liabilities | 662,567 | 277,663 | |
Digital assets borrowed | 2,312,004 | 2,361,161 | |
Payable to customers | 67,519 | 85,808 | |
Loans payable | 210,478 | 52,626 | |
Collateral payable | 2,612,219 | 1,980,171 | |
Notes payable - current | 441,316 | 428,545 | |
Other current liabilities | 170,364 | 85,062 | |
Total current liabilities | 6,664,726 | 5,311,518 | |
Non-current liabilities | |||
Notes payable | 6,307,116 | 2,432,510 | |
Digital assets borrowed, non-current | 31,593 | 56,107 | |
Other non-current liabilities (includes $83.8 and $72.3 million due to related parties) | 422,142 | 513,169 | |
Total non-current liabilities | 6,760,851 | 3,001,786 | |
Total liabilities | 13,425,577 | 8,313,304 | |
Equity | |||
Class A common stock, $0.001 par value; 2,000,000,000 shares authorized and 191,883,290 issued and outstanding | 191 | 192 | |
Convertible Class B common stock, $0.0000000001 par value; 500,000,000 shares authorized and 196,596,698 issued and outstanding | — | — | |
Additional Paid in Capital | 1,522,518 | 1,614,660 | |
Accumulated other comprehensive income (loss) | 4,627 | (2,038) | |
Retained Earnings | 386,688 | 342,921 | |
Total stockholders' equity(1) | 1,914,024 | 1,955,735 | |
Noncontrolling interest | 1,077,145 | 1,079,042 | |
Total equity | 2,991,169 | 3,034,777 | |
Total liabilities and equity | $ 16,416,746 | $ 11,348,081 |
(1) | For periods prior to the Reorganization Transactions, represents total GDH LP Unit Holders' Capital. |
Galaxy Digital Inc.'s Consolidated Statements of Operations and Other Comprehensive Income (Loss) (unaudited)
Three Months Ended | Nine Months Ended | ||||||||
(in thousands) | September 30, 2026 | September 30, 2025 | September 30, 2026 | September 30, 2025 | |||||
Revenues | $ 8,057,272 | $ 28,402,138 | $ 26,656,051 | $ 50,039,899 | |||||
Gains / (losses) from operations | 551,710 | 816,982 | 857,811 | 1,091,745 | |||||
Data center leasing revenue | 79,068 | — | 97,945 | — | |||||
Revenues and gains / (losses) from operations | 8,688,050 | 29,219,120 | 27,611,807 | 51,131,644 | |||||
Operating expenses: | |||||||||
Transaction expenses | 8,016,486 | 28,292,777 | 26,519,051 | 49,869,727 | |||||
Impairment of digital assets | 102,282 | 197,702 | 568,032 | 437,608 | |||||
Compensation and benefits | 82,186 | 85,048 | 249,730 | 206,970 | |||||
General and administrative | 25,258 | 51,303 | 58,606 | 137,048 | |||||
Depreciation and amortization | 21,884 | 7,397 | 36,884 | 27,468 | |||||
Technology | 17,328 | 11,515 | 48,345 | 33,000 | |||||
Professional fees | 13,865 | 14,451 | 43,908 | 58,014 | |||||
Total operating expenses | 8,279,289 | 28,660,193 | 27,524,556 | 50,769,835 | |||||
Other income / (expense): | |||||||||
Notes interest expense | (93,391) | (14,415) | (136,065) | (42,726) | |||||
Unrealized gain / (loss) on notes payable - derivative | — | — | — | (35,544) | |||||
Other income / (expense), net | 28,902 | 690 | 30,341 | 2,280 | |||||
Total other income / (expense) | (64,489) | (13,725) | (105,724) | (75,990) | |||||
Net income / (loss) before taxes | $ 344,272 | $ 545,202 | $ (18,473) | $ 285,819 | |||||
Income taxes expense / (benefit) | 21,500 | 40,145 | (39,617) | 45,503 | |||||
Net income / (loss) | $ 322,772 | $ 505,057 | $ 21,144 | $ 240,316 | |||||
Other comprehensive income (loss), net of tax | |||||||||
Change in fair value of cash flow hedges and treasury bills | 5,447 | (2,605) | 13,491 | (2,605) | |||||
Other comprehensive income (loss) | 5,447 | (2,605) | 13,491 | (2,605) | |||||
Comprehensive income (loss) | $ 328,219 | $ 502,452 | $ 34,635 | $ 237,711 | |||||
Comprehensive income / (loss) attributed to: | |||||||||
Class B Unit holders of GDH LP | — | — | — | (204,745) | |||||
Noncontrolling interests | 171,686 | 296,589 | (15,796) | 332,034 | |||||
Class A common stockholders of the Company(1) | $ 156,533 | $ 205,863 | $ 50,431 | $ 110,422 | |||||
Net income / (loss) per share of Class A common stock (2) | |||||||||
Net income (loss) used in calculation of net income / (loss) per share of Class A common stock (2) | $ 153,833 | $ 208,468 | $ 43,767 | $ 113,027 | |||||
Basic | $ 0.80 | $ 1.19 | $ 0.23 | $ 0.76 | |||||
Diluted | $ 0.66 | $ 1.01 | $ 0.14 | $ 0.56 | |||||
Weighted average shares outstanding used to compute net income / (loss) per share(3) | |||||||||
Basic | 193,344,582 | 174,709,471 | 192,767,396 | 148,730,331 | |||||
Diluted | 255,698,332 | 221,463,809 | 400,540,000 | 375,881,574 | |||||
(1) | For periods prior to the Reorganization Transactions, represents net income / (loss) attributable to Class A Units of GDH LP |
(2) | For periods prior to the Reorganization Transactions, represents net income / (loss) per Class A Unit of GDH LP |
(3) | For periods prior to the Reorganization Transactions, represents weighted average Class A Units of GDH LP used to calculate net income / (loss) per unit |
Ownership of GDH LP Limited Partnership Interests
September 30, 2026 | December31, 2025 | |||||||
Ownership | % interest | Ownership | % interest | |||||
Galaxy Digital Inc | 191,883,290 | 49.4 % | 192,695,681 | 49.3 % | ||||
Noncontrolling interests | 196,596,698 | 50.6 % | 198,408,277 | 50.7 % | ||||
Total | 388,479,988 | 100.0 % | 391,103,958 | 100.0 % | ||||
Reconciliation of Adjusted Gross Profit
The following table reconciles adjusted gross profit to revenues and gains / (losses) from operations for the three months ended September 30, 2026 and June 30, 2026:
Three Months Ended September 30, 2026 | ||||||||
(in thousands) | Digital Assets | Data Centers | Treasury and | Total | ||||
Revenues and gains / (losses) from operations | $ 8,169,905 | $ 88,995 | $ 429,150 | $ 8,688,050 | ||||
Less: Transaction expenses | 7,996,275 | 9,927 | 10,284 | 8,016,486 | ||||
Less: Impairment of digital assets | 102,282 | — | — | 102,282 | ||||
Adjusted gross profit | $ 71,348 | $ 79,068 | $ 418,866 | $ 569,282 | ||||
Three Months Ended June 30, 2026 | ||||||||
(in thousands) | Digital Assets | Data Centers | Treasury and | Total | ||||
Revenues and gains / (losses) from operations | $ 8,716,232 | $ 25,959 | $ (31,658) | $ 8,710,533 | ||||
Less: Transaction expenses | 8,469,179 | 5,816 | 10,826 | 8,485,821 | ||||
Less: Impairment of digital assets | 181,348 | — | — | 181,348 | ||||
Adjusted gross profit | $ 65,705 | $ 20,143 | $ (42,484) | $ 43,364 | ||||
Reconciliation of Adjusted EBITDA
The following table reconciles the Company's adjusted EBITDA figures to net income for the three months ended September 30, 2026 and June 30, 2026:
(in thousands) | Digital Assets | Data Centers | Treasury and | Three Months | ||||
Net income / (loss) | $ (24,728) | $ (435) | $ 347,935 | $ 322,772 | ||||
Add back: | ||||||||
Equity based compensation and related expense | 9,137 | 785 | 6,142 | 16,064 | ||||
Notes interest and other expense | — | 75,439 | 17,952 | 93,391 | ||||
Tax expense / (benefit) | (1,647) | (24) | 23,171 | 21,500 | ||||
Depreciation and amortization expense | 1,821 | 17,325 | 2,738 | 21,884 | ||||
Other (1) | 6,395 | (24,344) | (2,913) | (20,862) | ||||
Adjusted EBITDA | $ (9,022) | $ 68,746 | $ 395,025 | $ 454,749 | ||||
(in thousands) | Digital Assets | Data Centers | Treasury and | Three Months | ||||
Net income / (loss) | $ (19,048) | $ 31,155 | $ (97,423) | $ (85,316) | ||||
Add back: | ||||||||
Equity based compensation and related expense | 9,218 | 657 | 6,331 | 16,206 | ||||
Notes interest and other expense | — | 7,365 | 17,732 | 25,097 | ||||
Tax expense / (benefit) | (1,704) | (32,450) | (8,717) | (42,871) | ||||
Depreciation and amortization expense | 1,650 | 4,762 | 2,749 | 9,161 | ||||
Other (1) | (646) | — | 1,111 | 465 | ||||
Adjusted EBITDA | $ (10,530) | $ 11,489 | $ (78,217) | $ (77,258) | ||||
(1) Includes non-operating income and expenses, as well as other discrete items not indicative of ongoing operating performance, none of which were individually significant. |
Reconciliation of Adjusted Income (Loss) per Share
The adjusted income (loss) per share represents the diluted income (loss) per Class A common stock assuming all outstanding noncontrolling interest holders exchanged their LP units in GDH LP for Class A common stock of the Company. In periods where the noncontrolling interest is already included in the GAAP diluted income (loss) per share, the adjusted income (loss) per share is identical to the GAAP income (loss) per share. Prior to the Reorganization Transactions, the noncontrolling interest was represented by Class B Units of Galaxy Digital Holdings LP.
The following table reconciles the Company's adjusted income (loss) per share figures to diluted and basic income (loss) per share for the three and nine months ended September 30, 2026 and September 30, 2025:
Three Months Ended | Nine Months Ended | ||||||
(in thousands, except for share data and per share amounts) | September 30, 2026 | September 30, 2025 | September 30, 2026 | September 30, 2025 | |||
Net income (loss) to Class A unitholders | $ 153,833 | $ 208,468 | $ 43,767 | $ 113,027 | |||
Weighted-average Class A shares outstanding | 193,344,582 | 174,709,471 | 192,767,396 | 148,730,331 | |||
Basic earnings (loss) per share | $ 0.80 | $ 1.19 | $ 0.23 | $ 0.76 | |||
Numerator: | |||||||
Net income (loss) to Class A - basic | $ 153,833 | $ 208,468 | $ 43,767 | $ 113,027 | |||
Add: Income (loss) attributed to NCI | — | 14,688 | 13,092 | 96,230 | |||
Add: Other note / award adjustments | 16,086 | — | — | — | |||
Net income (loss) to Class A - diluted | 169,919 | 223,156 | 56,859 | 209,257 | |||
Denominator: | |||||||
WA Class A shares outstanding - basic | 193,344,582 | 174,709,471 | 192,767,396 | 148,730,331 | |||
Add: NCI share exchange | — | 30,031,054 | 197,521,482 | 227,151,243 | |||
Add: Compensatory awards | 8,790,044 | 16,723,284 | 10,251,122 | — | |||
Add: Convertible notes | 53,563,706 | — | — | — | |||
WA shares outstanding - diluted | 255,698,332 | 221,463,809 | 400,540,000 | 375,881,574 | |||
Diluted earnings (loss) per share | $ 0.66 | $ 1.01 | $ 0.14 | $ 0.56 | |||
Net income used to calculate diluted EPS | $ 169,919 | $ 223,156 | $ 56,859 | $ 209,257 | |||
Noncontrolling interest not included in diluted EPS numerator | 204,246 | 253,139 | — | — | |||
Net income used to calculate adjusted income (loss) per share | $ 374,165 | $ 476,295 | $ 56,859 | $ 209,257 | |||
Weighted average number of Class A Common Stock shares for the purposes of diluted income (loss) per share | 255,698,332 | 221,463,809 | 400,540,000 | 375,881,574 | |||
Additional noncontrolling interest weighted average shares outstanding | 196,596,698 | 202,646,202 | — | — | |||
Weighted average number of Class A Common Stock shares for the purposes of Adjusted income (loss) per share | 452,295,030 | 424,110,011 | 400,540,000 | 375,881,574 | |||
Adjusted income (loss) per share | $ 0.83 | $ 1.12 | $ 0.14 | $ 0.56 | |||

 View original content to download multimedia:https://www.prnewswire.com/news-releases/galaxy-announces-third-quarter-2026-financial-results-302920339.html
SOURCE Galaxy Digital Inc.


 Login